Introduction
Brakes are an important part of the Mini 4WD setup. Too little brake will risk the car flying off the track or flipped and too much will risk the car running too slow. So the question that always puzzles many fellow Mini 4WD racers is that “Are these brakes on my race car a good setup or not? Are they too much or even worse too little?”
You saw the track layout. You prep your car based on the research you did, the videos you saw, the recommendations from others and your very own experience. You adjusted some brake mount and about to stick some brake sponge and may be some tape on them. But then, how do you know which colour of brake sponge to use? How big of a piece do you need? How high to mount them? Would the brakes be good enough for the job etc… We don’t usually know until we test the car on the track. But sometimes there is no chance to test them at all. So how do we know we made the right decision? Or at least made an informed decision?

Would it be nice if there is a way to estimate the effectiveness of our brake setup based on a certain performance requirements in mind? Let’s explore this topic today.
Please note this is a working article, so will continue updating this in the next few days.
The Scenario
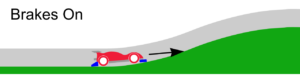
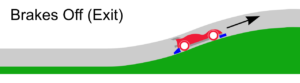
When the car is going up a slope section, the front and rear brakes will be engaged and the wheels are off the track due to the curvature of the slope section (figure 2). At this point the brakes (in blue) slow the car down over a short distance (s). Gravity also reduces the speed of the car by a small amount. Then after a short distance, the wheels are back on the track and the brakes are off (figure 3) and the car continues travelling up the slope section.

The good news is that we can use science to calculate the speed reduction of the brakes (i.e. how much they can slow the car down). Let’s look at some science in the next section.
The Science
We are going to explore energy theory and formula today
Kinetic energy – the kinetic energy of an object is the form of energy that it possesses due to its motion. In classical mechanics, the kinetic energy of a non-rotating object of mass (m) traveling at a speed (v) is ½ mv2 (Source: Wikipedia)
Work – the kinetic energy of an object is equal to the force (F) in the direction of motion times its displacement (s), needed to accelerate the object from rest to its given speed. The same amount of work is done by the object when decelerating from its current speed to a state of rest. So brake deceleration energy is frictional force generated by the brakes on the track surface (Ff) moving over a distance (s) is Ff x s
Frictional force of brake pads Ff = Normal force (N) × friction co-efficient of our brake pads (μ).
Normal force is equal to mass of the car (m) × gravity acceleration (g)
Gravity acceleration (g) is ~9.8m/s2
Frictional force of brake pads (Ff) = m × g × μ
As brake deceleration energy (Ef) = Ff x s
Therefore: Brake deceleration energy (Ef)= m × g × μ × s
(If you want to learn more about the science behind friction coefficient, please refer to article Friction)
Gravitational energy – Gravitational energy or gravitational potential energy is the potential energy an object with mass has due to the gravitational potential of its position in a gravitational field. When the car goes up the slope, it gains gravitational potential energy while it loses kinetic energy. Gravitational potential energy is the mass of the object (m) times gravitational acceleration (g) times the height gained (h). i.e.
Eg = m × g × h
(Source: Wikipedia)
So based on conservation of energy, the Kinetic energy (Ei) when the car enters the jump (in) must equal to
- Brake deceleration energy (Ef) plus
- The gain of gravitational potential energy when going up the slope (Eg) plus
- The Kinetic energy after brakes were engaged (out) (Eo)
i.e. Entry Kinetic energy (Ei) = Brake deceleration energy (Ef) + gravitational potential energy (Eg)+ Exit Kinetic energy (Eo)
Simply put it: Ei = Ef + Eg + Eo
Given:
Ei = ½ mvi2
Ef = mgμs
Eg = mgh
Eo = ½ mvo2
Where:
m = mass of our Mini 4WD (in kg)
vi = speed of car when entering the jump (in m/s)
g = gravity acceleration (~9.8m/s2)
μ = friction co-efficient of the brake pads
s = distance the brakes engaged (in metres)
h = height the car gains when going up the slope (in metres)
vo = speed of car after braking (in m/s)
Combining them together:
½ mvi2 = (mgμs) + (mgh) + ½ mvo2
We can simplify the equation:
½ mvi2 = (mgμs) + (mgh) + ½ mvo2
½ vi2 = g × μ × s + g × h + ½ vo2 (take out m)
vi2 = 2 × g × μ × s + 2 × g × h + vo2 (re-arranged the ½)
vo2 = vi2 – 2 × g × μ × s – 2 × g × h (rearrange vo and Vi)
vo= √( vi2 – 2 × g × μ × s – 2 × g × h )
Therefore
vo= √( vi2 – 2gμs – 2gh )
And the speed where the brakes and gravity reduce (vr) is vr = vi – vo
This is the formula we can use to estimate the effectiveness of our brakes. Let’s call it Mini 4WD Brake Performance Estimator Model One.
Assumptions
- All the wheels are off (not touching the track surface) when the brakes are engaged.
- Rollers/air friction doesn’t play a part in this.
- The track surface is consistent, no one part slipperier than the other.
- Mechanical friction in the drive train doesn’t have an effect.
- No other factors that can affect the system.
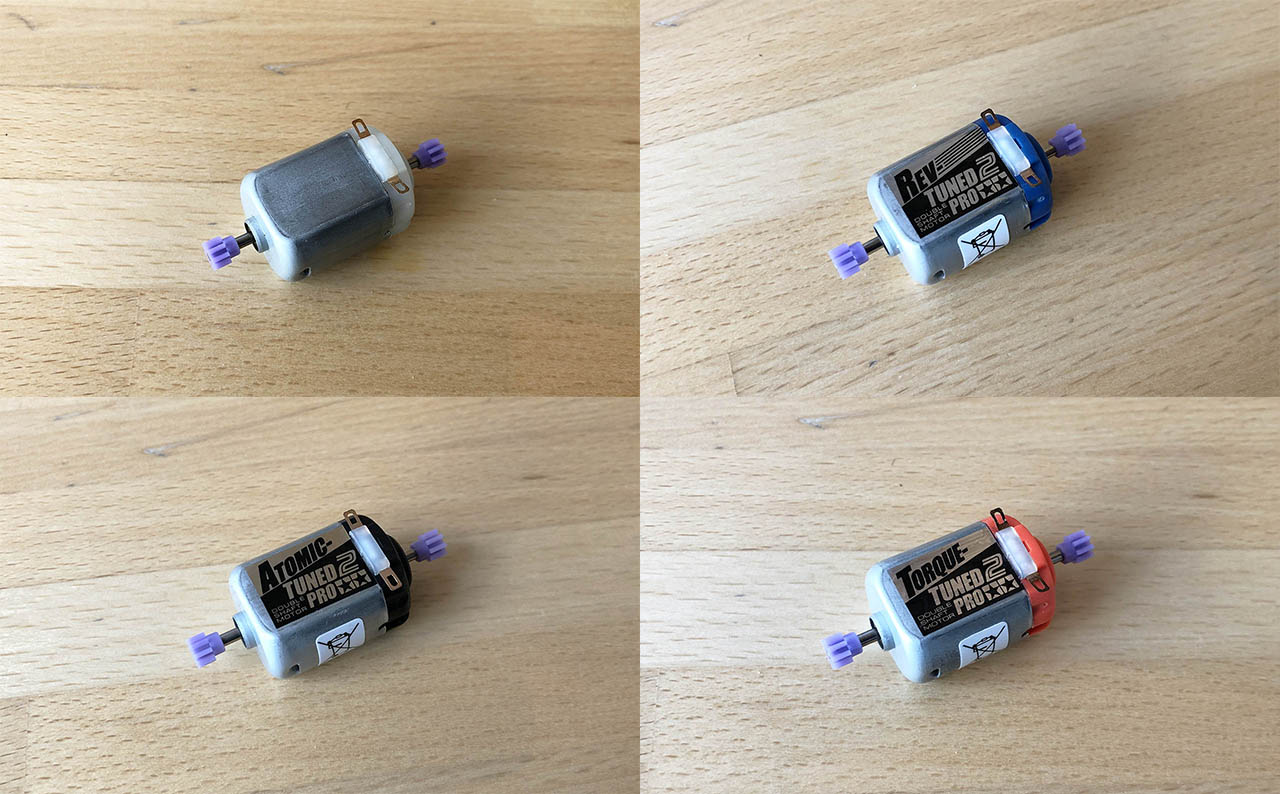
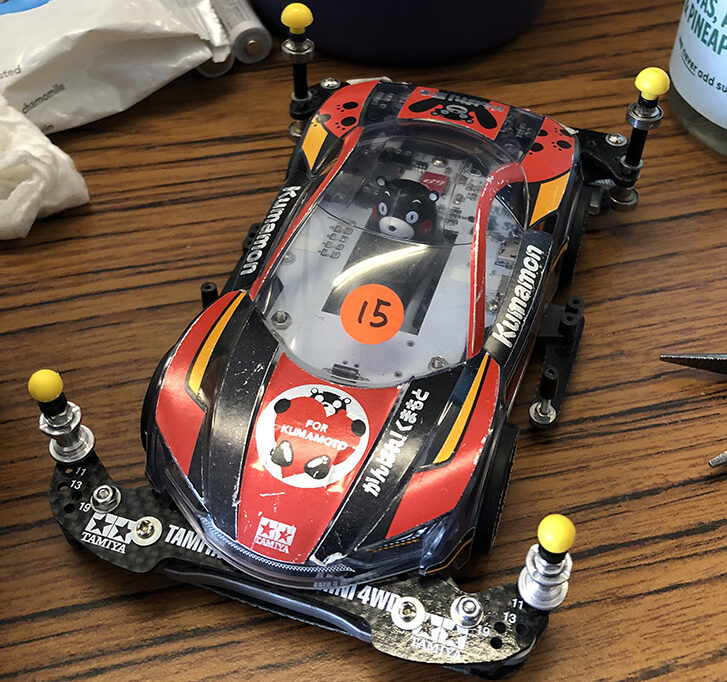
Our Setup
We installed the brakes on our AI Mini 4WD prototype car based on Kumamon Mini 4WD GT Racer (Item No: 95281). Here are the parts we used:
- BASIC TUNE-UP PARTS SET for AR CHASSIS (Item No:15450)
- FRONT UNDER GUARD (Item No:15405)
- BRAKE SET (for AR CHASSIS) (Item No:15458)
- BRAKE SPONGE SET (3 TYPES) (Item No:15441)
- ROLLER ANGLE ADJUSTER PLATE SET (Item No:15373)
Gathering Numbers
So in order for us to calculate the braking effect, we need to know a few numbers:
- (A) the speed of the car (vi) when entering the jump
- (B) the distance (s) the brakes were engaged
- (C) the height (h) the car gains when going up the slope
- (D) the friction co-efficient (μ) of the brakes on the track surface
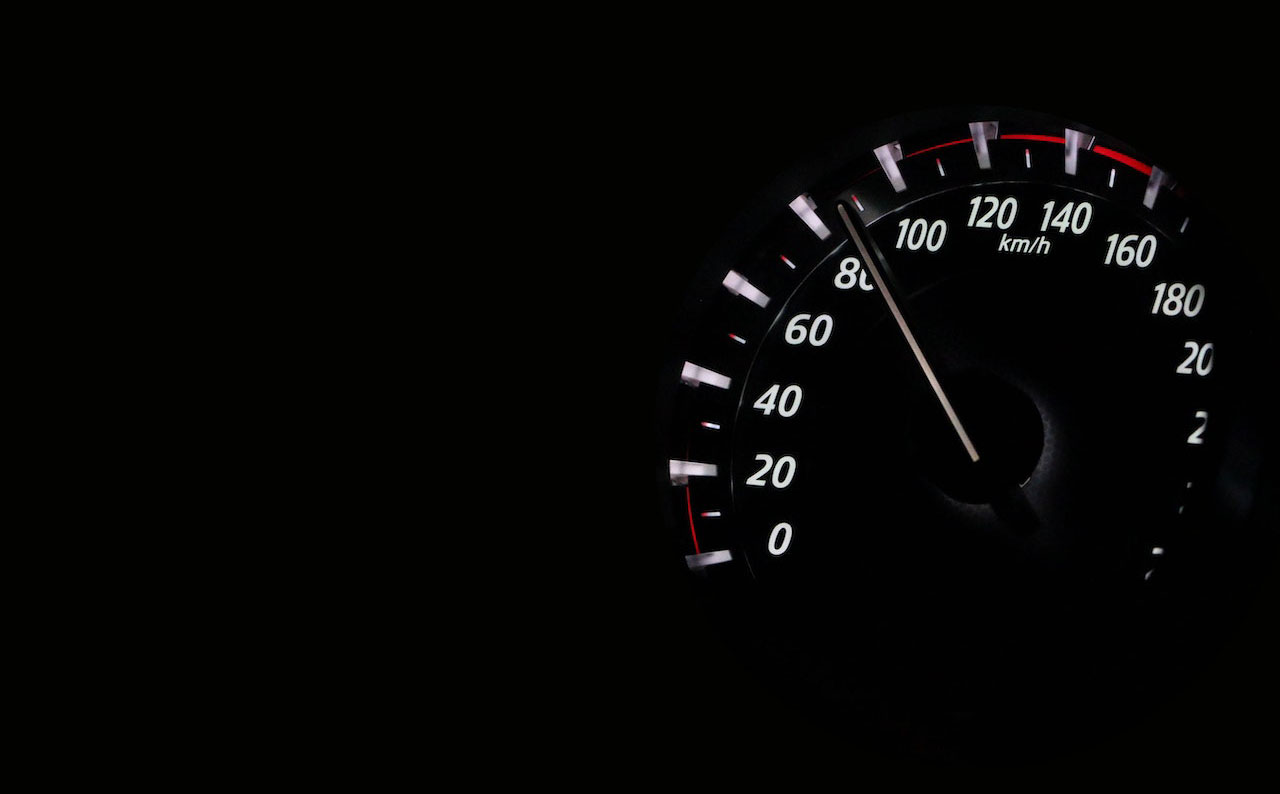
(A) The speed of the car (vi) when entering the jump
Although it is hard to measure the speed of the car when entering the jump without the measuring equipment like we have with our AI Mini 4WD prototypes. It is possible to estimate the speed by checking the top speed and average speed from our motor test results. Alternatively we can set a range of entry speed, calculate the effect of each and plot a chart to visualise the data.
(B) The distance (s) the brakes were engaged
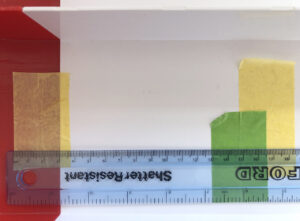
If you happen to have access to a slope section or jump, you can use it to check the distance of which the brakes are engaged. Use some masking tape to help marking the start and end, then use a soft ruler to measure the distance. From our setup with early brakes engagement, we measured a distance of 12.9cm (0.129m).
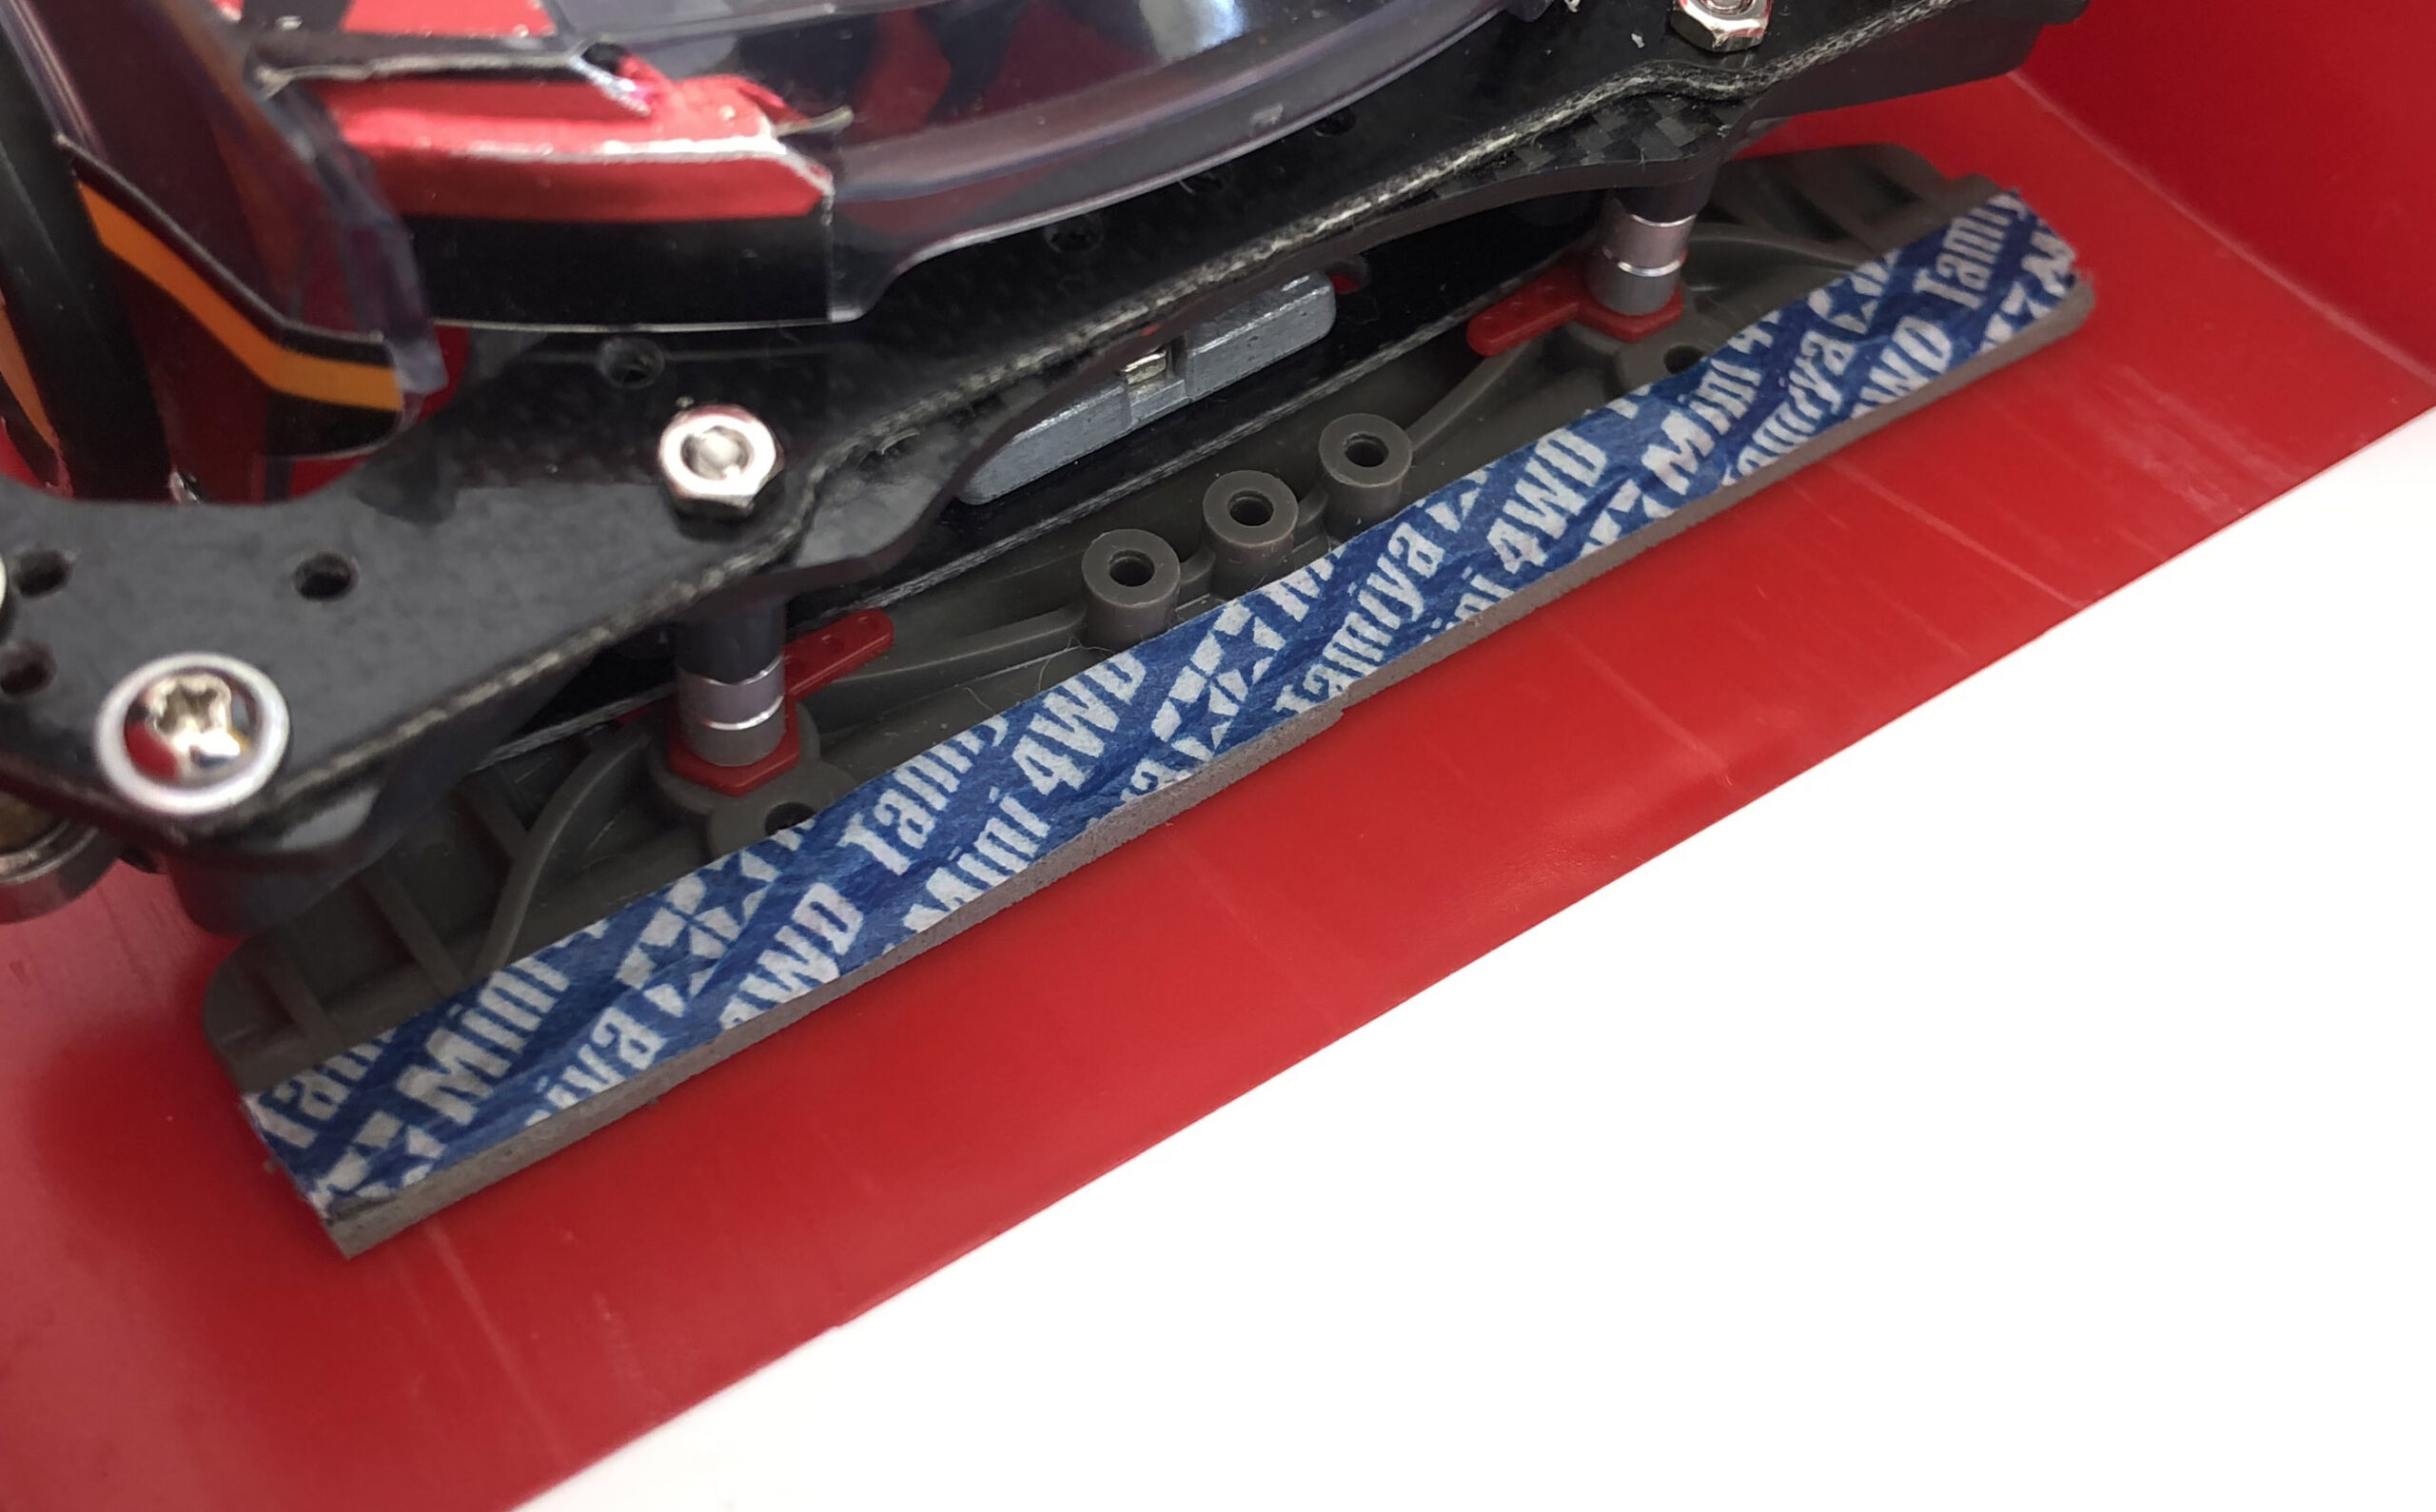
(C) The height (h) the car gains when going up the slope
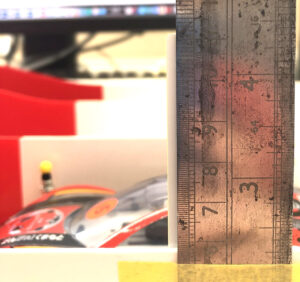
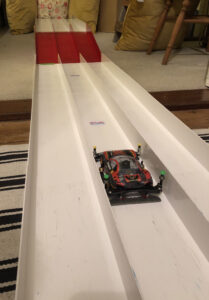
For the distance measurement, you can use a ruler and a piece of measuring stick (e.g. a slim piece of plastic as shown in the picture below in white). Fasten the ruler to the side of a straight section and measure the top of the stick (h1), then place the car on the slope section where the car is at the top of the brake engagement, fasten the ruler to the side of the slope section where the centre of the car is, then use the stick to measure the height again (h2). The difference of the two measurements (h1 – h2) will give you the height gained when the car goes up the slope (h). The height gained (h) was 1.9cm.
(D) The friction co-efficient (μ) of the brakes on the track surface
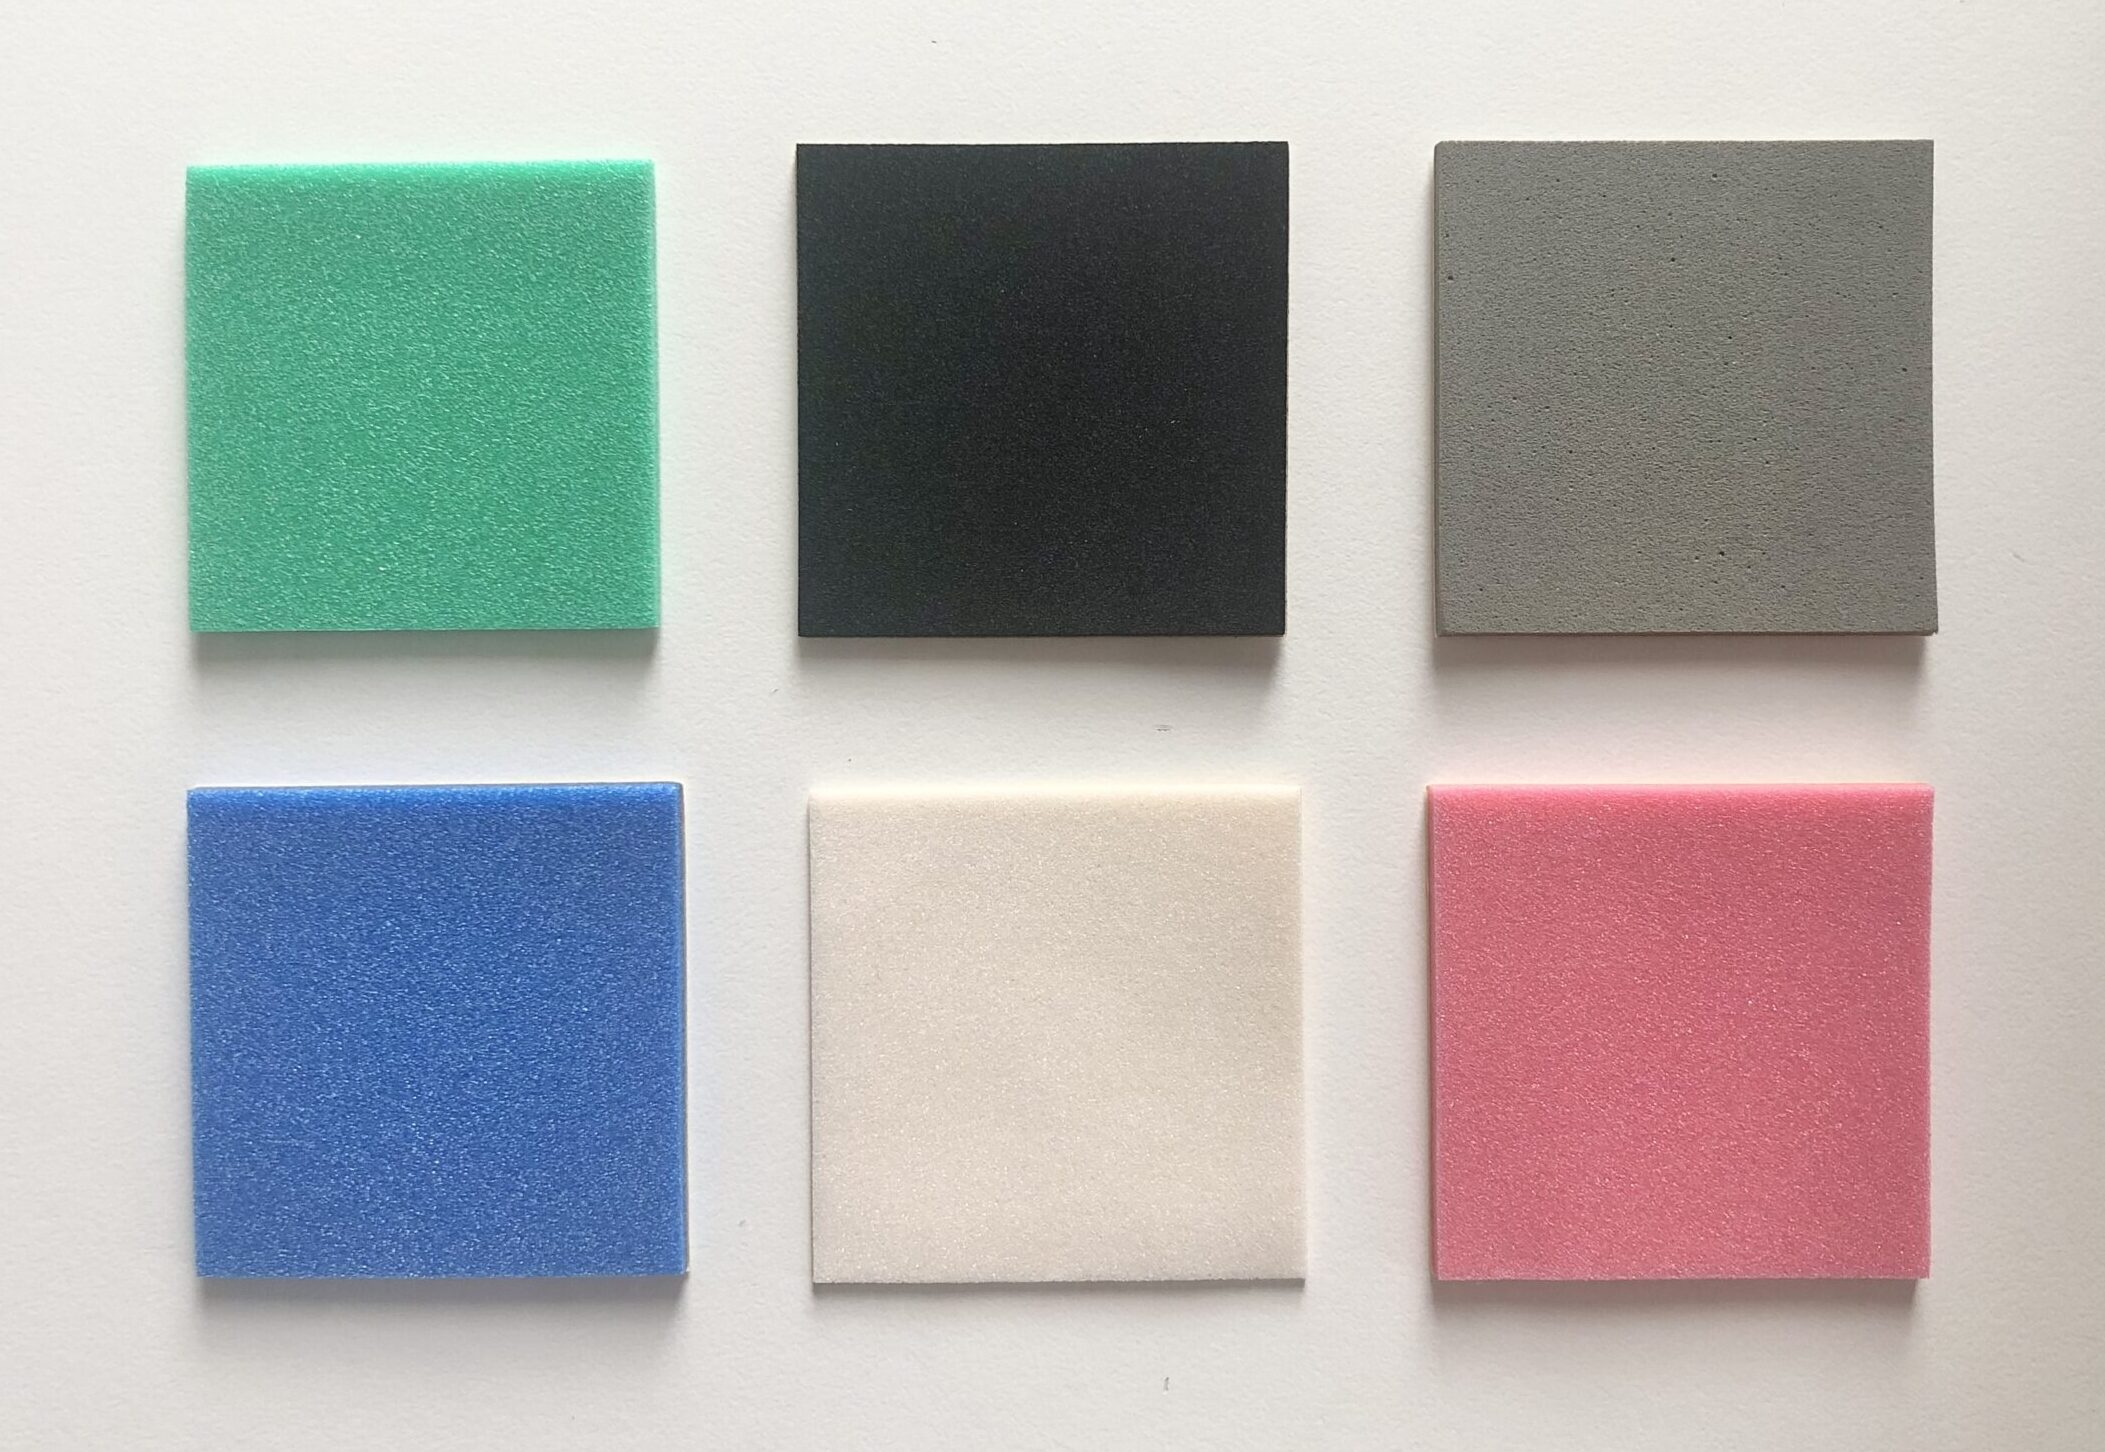
Certainly you can conduct your own experiment using a similar method that we used before to measure the friction co-efficient of different brake sponge and material. If you don’t have time to do this, you can use the measurement results that we got before as a starting point. Here they are:
Brake sponge pad (frictional co-efficient per square millimetre):
- Green: 0.000884904
- Blue: 0.000892817
- White: 0.001968575
- Red: 0.002321629
- Black: 0.003230833
- Grey: 0.004918934
We can use these to estimate the frictional coefficient for the size of the brake pad we have, for example, if our grey sponge pad is 89mm by 7mm in size. We can calculate the friction co-efficient of the sponge pad to be:
89 × 7 × 0.004918934 = 3.064495882
Items:
- Standard Plastic: 0.1703
- Tamiya Black Tape: 0.4602
- FRP: Although we haven’t had the chance to measure friction co-efficient of FRPs, we can assume it will be similar to standard plastic as it is coated with resin. So it should be around 0.1703
Since our car has FRP in front and grey brake pad of size (89mm x 7mm) at the back and the car has a weight distribution of 47% in front and 53% at the rear, the combined friction co-efficient (μ) = 0.1703 × 47% + 3.064495882 × 53% = 1.7042 (rounded).
Putting the numbers together
So we can now populate the formula with some numbers:
Formula: vo= √( vi2 – 2gμs – 2gh )
Add numbers: vo= √( vi2 – 2 × 9.8 × 1.7042 × 0.129 – 2 × 9.8 x 0.019 )
vo= √( vi2 – 4.3821 – 0.3724)
vo= √( vi2 – 4.7545)
Visualise the Estimates
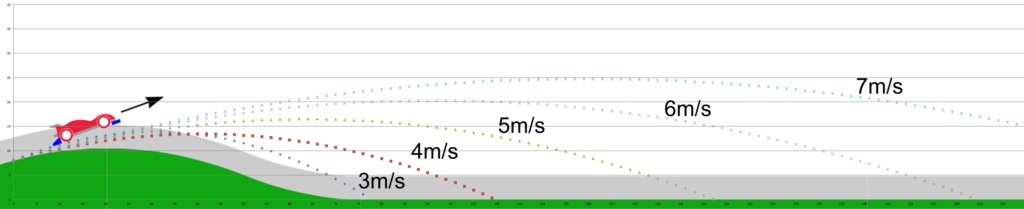
Let’s explore the speed range from 3 m/s to 10 m/s, plot a chart to visualise the estimates.
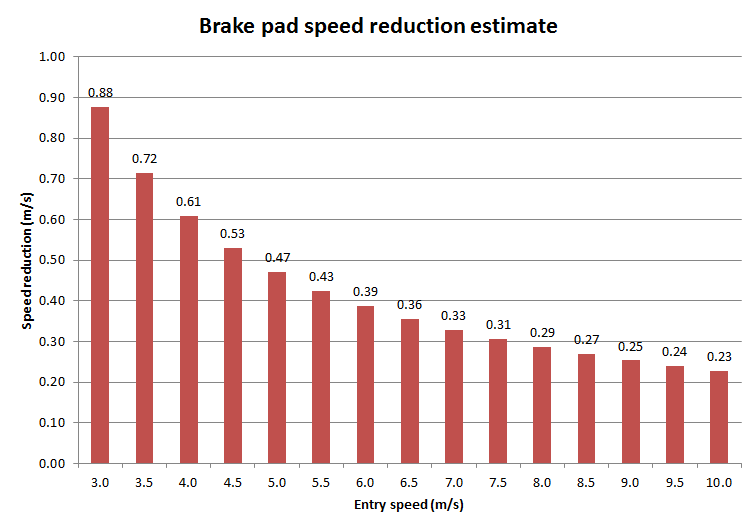
From the chart, we can see that the faster the car enters the jump section, the less effective the brakes will be. For example, if the car enters at 5 m/s, the speed will be reduced by around 0.47 m/s, exiting at around 4.53 m/s after braking. Whereas if the car enters at 10 m/s, the speed will be reduced by around 0.23 m/s, exiting at around 9.77 m/s. Therefore, if you double your speed, the effectiveness of the brakes will be more than halved.
Validation
This all sounded nice and good, but how accurate is the model?
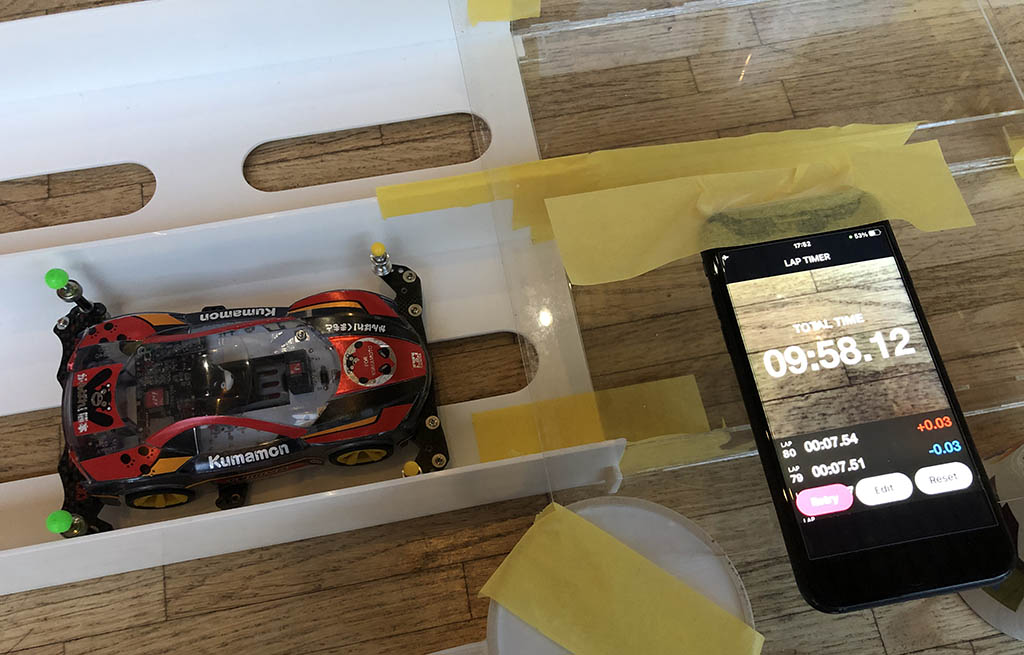
We ran some experiments measuring the effectiveness of the brakes with our Mini 4WD AI prototype car. We setup a straight track with a slope session in several different combinations. We manually pushed/fired our test car at varies speeds from the start line. The counter gears were taken out so the motor won’t have an effect on the wheels. The on-board computer was set to measurement mode.
Then we extracted the data and compared it with estimated values. We assumed our measurement device is accurate enough to give us a representative result.
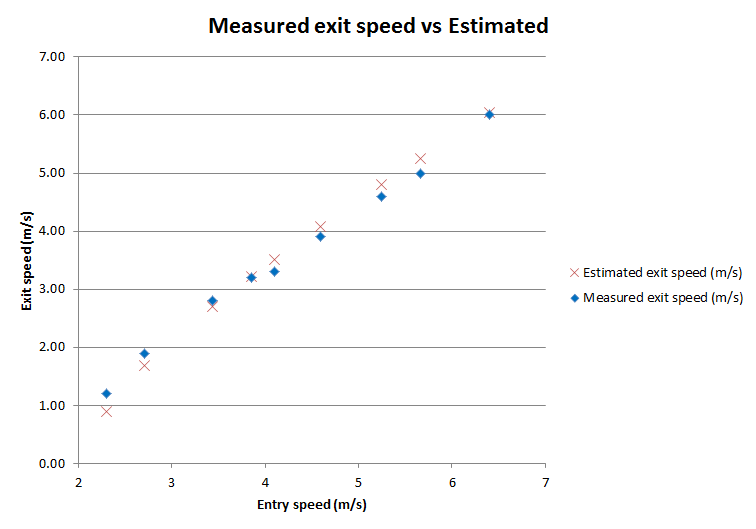
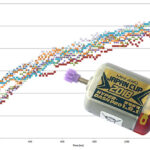
The measured results seem to be very close to the estimated result. Let’s conduct a linear regression analysis to see how well the measured data fit with estimated.
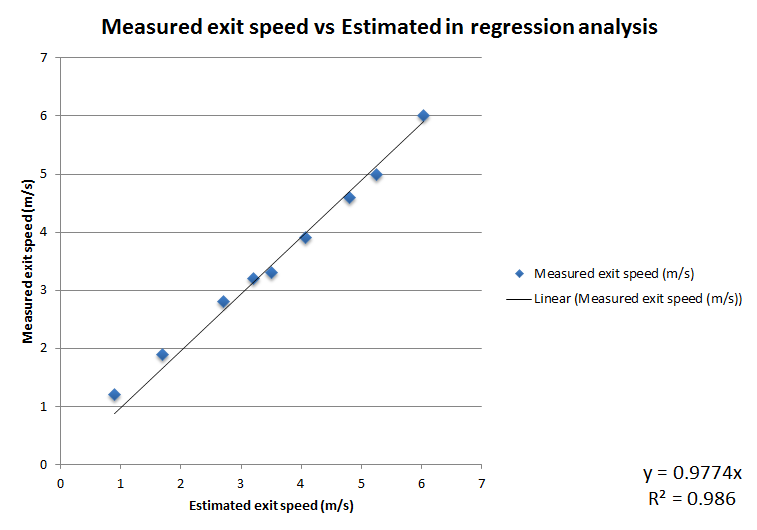
Even though we only have 9 measurements, it looks like they do match the model pretty well. We set the y-intercept to 0. Although the gradient is ~0.98 not a perfect 1.0 but still very close, the R2 is ~0.99 which is statistically significant. We have to accept some measurements error. But all in all, our model is pretty good.
What’s missing?
Certainly there are things we haven’t included in the model. One thing we can think of is that we haven’t included the centrifugal force generated when the car is pitching up upon entering the slope section. Then the downward acceleration the car experiences should be larger than gravitational acceleration and hence more braking power. We will take a look at this in the future when we revise the model.
Why should I care about this?
When the car goes through the slope section, the higher the exit speed, the more energy it carries. This means a higher and longer jump. The higher and the longer it jumps, the higher the risk of track out or a bad landing. We will explore how speed affects the flight trajectory of the car and stability of landing in a follow up article, so watch this space.
What does it mean to fellow racers?
As you can see in the chart above, the faster the car goes the less effective the brakes will be. So if we want to improve the speed of the car but also achieve a stable landing after jump, we might need to more than double the braking power to achieve the same amount of speed reduction.
Now there is a model you can use to estimate the effectiveness of your brakes and you can use it to make an informed decision on the brake choices and setup options, before putting the car in the track. Hopefully you find this better than “guess work” or “gut feel”.
In summary
We explored how science can help us estimates the effectiveness of our brakes. Our model “Mini 4WD Brake Performance Estimator Model One” can help us explore and make an informed decision in what brake setup and the size of the pads to reach a certain braking performance level. This should help us get the brake setup right much quicker and hopefully with fewer crashes.
The model is no means conclusive. Your running condition, parts and setup might produce slightly different results. However the model does give us a good tool to estimating the effectiveness of Mini 4WD brakes. We also hope that this article provides you a useful insight to the subject matter.
What would you take away from this experiment? How would you improve it? Please feel free to leave a comment on our Facebook page @Mini4Science or through our contact us page.
Brake Power Estimator Calculator
To make it easier for fellow racer, we are planning to include a brake power estimator calculator in this article to help you make those calculations. So watch this space.
![7 different Tamiya Mini 4WD low profile small diameter tyres [Item no: 95208, 95205,95152, 95281, 95304]](https://www.mini4science.com/wp-content/uploads/2024/09/IMG_0538_mod2-150x150.jpg)
![8 different Tamiya Mini 4WD metal rollers [Item no: 95612, 15522, 95643, 95497, 15426, 95160, 15345, 15475]](https://www.mini4science.com/wp-content/uploads/2024/07/IMG_0296-150x150.jpg)


![7 different Tamiya Mini 4WD low profile small diameter tyres [Item no: 95208, 95205,95152, 95281, 95304]](https://www.mini4science.com/wp-content/uploads/2024/09/IMG_0538_mod2.jpg)
![8 different Tamiya Mini 4WD metal rollers [Item no: 95612, 15522, 95643, 95497, 15426, 95160, 15345, 15475]](https://www.mini4science.com/wp-content/uploads/2024/07/IMG_0296-scaled.jpg)